a.) Release mode – ARC or Manual (ARC stands for “Automatic Release”)
b.) Compression behavior – Electro or Opto
c.) Character – Warm or Smooth
d.) Compressor Threshold
e.) Compressor Attack
f.) Compressor Ratio
g.) Compressor Make up gain
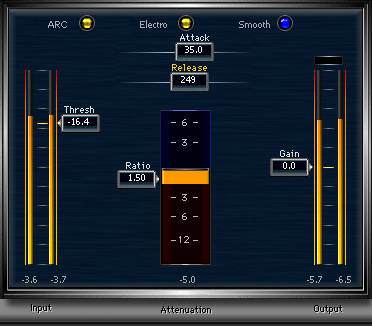
Below are the recommended settings to start for Rcomp for mix bus compression:
a.) Release mode = ARC (automatic release is recommended because the song beats per minute can vary across the entire mix)
b.) Compression behavior = Electro (recommended with moderate compression applications such as in mix buss)
c.) Character = Smooth (recommended because you will need the sound to be as close as the original)
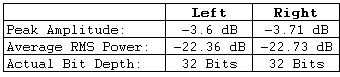
d.) Threshold = Average RMS power (higher figure in either LEFT or RIGHT channel) + 6dBFS
Since the mix down example has around -22.36dB (higher figure) average RMS power. The starting threshold is = -22.36dBFS + 6dBFS= -16.36 dBFS
e.) Compressor attack = 35ms (This is medium-set attack time. Small attack time can affect well-shaped transients that are important to the mix.)
f.) Compressor Ratio = 1.5:1
g.) Compressor make up gain = ~dBFS reduction after compression
h.) Release time (ms) = 30000/bpm
The tricky part is setting the release time. First, you need to read this tutorial on how to measure the song tempo in BPM. Take note that you will need to convert your mix down to an MP3 file first so that the BPM software can measure it. Using that tool, the BPM of the mix down is 120.02 beats per minute. So the starting release time of the compressor is:
Release time = 30,000/120.02 = 249ms ~ 250ms
Now press Control A, to select the entire waveform and implement the above compressor settings to Rcomp. Do not yet apply a make-up gain.
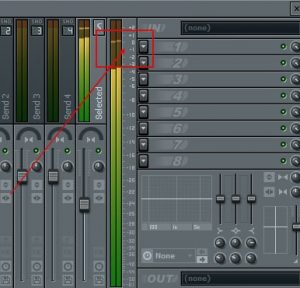
Step4.) Click “Preview” of Rcomp to listen to the results. And make sure that the attenuation in real time should not exceed to somewhere around -5dBFS (this is maximum not average) after song. Make sure most of the time it hits around -1dBFS to -3dBFS which should be the average/targeted dB reduction. See screenshot:
It shows that at one time the maximum attenuation is -5dBFS; however most of the time the attenuation meter is hitting somewhere around -1dBFS to -3dBFs which is OK. If it does not hit the target, lower down the threshold from -16.4dBFS to -15dBFS until the dB reduction shown in attenuation meter is acceptable. Use your ears to listen to any pumping presence, distortion, bad results, etc and tweak your attack/release time conservatively for best results.
Step5.) If everything is OK, apply a +2dB make up gain on the compressor. Listen to it again and finally hit OK to implement the settings.
Step6.) Confirm if the dB reduction, peak amplitude and average power SPL after compression is acceptable by getting the waveform statistics again. This is the result:
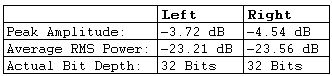
Although the statistics are not exactly the same as before compression, the subjective volume is somewhat comparable. Also the peak amplitude is less than -3dFS. This is the mix down after implementing the mix buss compression:
The volume is obviously low because this not yet mastered. Comparing before, the mix cohesiveness and punch has improved significantly as compared without a mix bus compression.
Content last updated on June 20, 2012


4 Responses
Also here: http://www.orban.com/about/articles/
Good luck in your search.
Hi Yusri, you can read some details here: http://www.scribd.com/doc/9140529/Orban-OptimodPC-1100-v201-Manual
My TV station is using the orban optimod for transmission, what is a similar function with the mix bus compression and I need more detail about orban proceesor..
nice~!!!