
OK so you have encountered a lot about “RMS” in audio recording, mixing and mastering. You might have read it many times in different tutorials featured in this blog or in recording forums. So what is really RMS?
RMS is Root Mean Square
It is assumed you are not a mathematician or have strong engineering knowledge so let’s explain this term in the easiest way. RMS stands for Root mean square. Do not confuse with those squares or means; the easiest way to understand RMS is simply it’s just an unique way of finding out the “average”.
Why not simply use the word “average” instead of “RMS”? Well, technically RMS is used to characterize the “average” of continuous varying signals such as audio, electrical signals, sound, etc.
Like any properties of a continuous signal such as audio or electrical signals. It can be characterized as having a maximum, minimum and average. In audio waveforms, these maximum is often called “peak” signal and often measured in dB in digital. In digital audio, the maximum allowable is 0dB. If it exceeds that amount, distortion would occur.
Between the minimum (the quietest sections of the audio) and the loudest section (towards 0dBFS, the peak) is where the RMS value can be found. It would be depicted on the screenshot below:
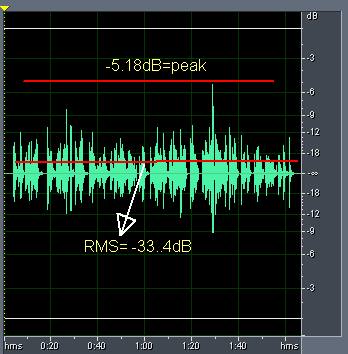
RMS vs Peaks in audio waveform
Now you can understand these terms very easily. The highest point of the waveform is called “peak”, the value shown is -5.18dB. The RMS is very far away down at -33.4dB.
The origin of RMS value in digital audio
As promised to you, there won’t be showcasing of complex mathematics behind RMS. But one thing worth observing on the above screenshot is that the RMS value seems to be found at location where most common signal levels are also found.
Since the RMS is at -33.4dB. This is also the “average” loudness of the waveform taking into account all “instances” of loudness statistics in the waveform.
To understand the computation graphically, let’s use a histogram which is a tool to show the distribution/occurrences of loudness throughout the waveform. See the histogram below:
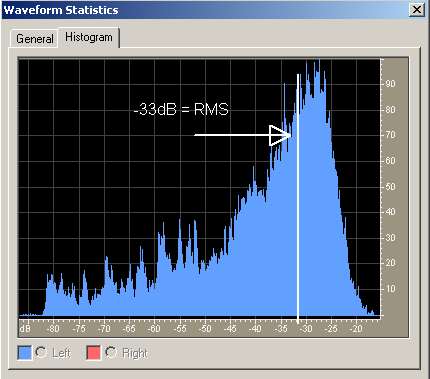
Histogram loudness distribution
Interpreting the histogram, the RMS value is found in the most common loudness region of the waveform which is around -35dB to -25dB. However it’s computed to be -33dB and not -28dB where it has the highest number of occurrences as shown in the histogram; why?
The reason is that the loudness is skewed to your left and RMS takes consideration of all loudness data in the waveform. It is why the RMS is slightly skewed from -28dB to the actual value is -33.4dB.
Let’s present a normalized audio (where loud and quite sections are even, so it’s a highly compressed audio), and see where the RMS can be found. Take a look at the screenshot below:
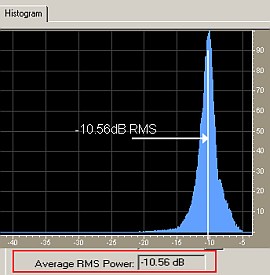
normalized histogram loudness
Since the entire audio is now balanced (not skewed), the RMS is found in the center and coincides exactly with the region of highest occurrences as shown in the histogram (which is -10.56dB).
RMS is “Perceived Loudness”
Our ears are sensitive to loudness and tend to average out the loudness coming to it. Human ear and brain can only characterize the audio whether it’s loud, soft or medium. Human ears cannot detect exactly where the peaks and nulls occur in the waveform but we can say how loud or soft the music is.
This is why RMS is the most often used measurement in perceived loudness. As RMS value gets closer to 0dB (maximum), the perceived loudness would also be getting louder.
In audio mastering, this is commonly used and often abused. Bear in mind that extreme adjustments’ audio mastering tools such as Waves LinEQ and L2 Ultramaximizer can squash the audio. This will in turn reduce the differences between loud and soft parts of the music thus the perceived dynamic range are gone although the perceived loudness is at maximum.
In this post on a true measurement of “quality” loudness in audio mastering; the perfect loudness for mastering is not solely based on RMS measurement but a balance between dynamic range and loudness.
Commonly Asked Questions about RMS
1.) What are the differences between RMS and Peak audio?
It has been clearly discussed previously that RMS is more or less the “average” loudness of the waveform whereas peak audio is the maximum. You can also refer to the associated screenshot of the waveform for illustration.
2.) Is there a “standard” RMS levels for mastering?
No, it is encouraged you will read this post on the true measurement of loudness to emphasize the importance of considering dynamics in finding the optimum loudness levels for your master.
3.) Does RMS can be used to describe average power?Like what I’ve seen in home appliances specifications.
Yes, in home appliances it should be well be understood that RMS power (as used by manufacturers, though not entirely an accurate term for that) is AVERAGE POWER. So from the equation (just a very little math):
Average Power = (Voltage RMS) x (Current RMS)
Average power is computed by multiplying the RMS voltage and the current. Thus, you have the average power handling capability of the device whether a hi-fi speakers or studio monitoring equipment.
Average Power specifications are important because it tells the real power/loudness capability of the equipment such as studio monitors/hi-fi speakers. Consider this comparison:
a.) Rated 500 Watts Peak
b.) Rated 500 Watts RMS
Obviously 500 watts RMS is powerful because power rating is now the average unlike 500 watts peak where it’s only the peak that has been considered (it will have a lower average).
4.) Would I compress in terms of RMS or peak?
If you understood the above concepts correctly, you will learn that you should not be compressing in terms of RMS because most audio compression applications are compressing peaks and not averages of the volume. For example, vocalists are known to have an uneven loudness response (sudden loudness transients or soft). By compressing peaks, you can tame the uneven response accurately.
The suggestions provided in the audio compression tips tutorial are compressing the audio in terms of peaks.
5.) How do I measure the RMS of the audio?
Most audio editors comes with RMS measuring capability. A good example is Adobe Audition waveform statistics feature (the screenshots above are created using the tool).
You can check the manual of your audio editor/DAW whether it comes with this feature.
Content last updated on July 5, 2012