3.Mod Mix
The Modulation Mix knob is variable between oscillator 3 and “noise” as its sources. If the knob is rotated counterclockwise the source is oscillator 3. With the knob, turned clockwise “noise” is the source. If the knob is in the center position both oscillator 3 and “noise” are equally modulated. The switch located between the controllers’ section and the oscillator bank is “oscillator modulation.”
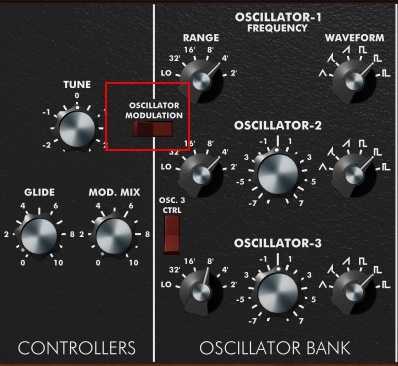
When this switch is “on” the oscillators can be modulated by Oscillator 3.
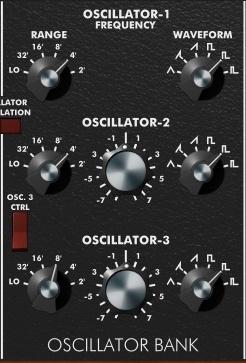
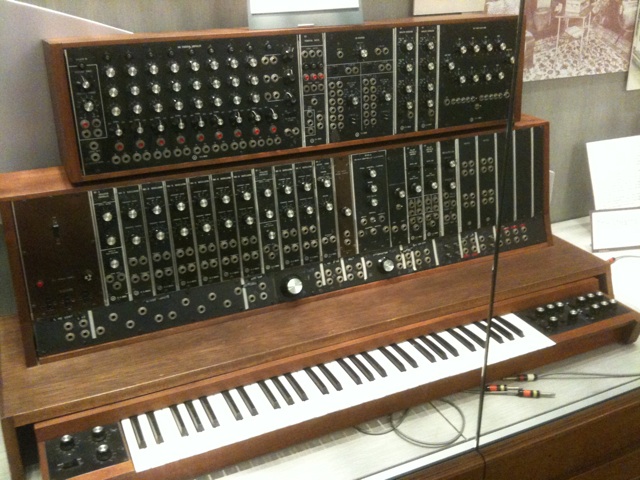
The oscillator bank is where you will generate a sound. The Mini Moog has 3 oscillators. Each one can be manipulated to generate its own tone.
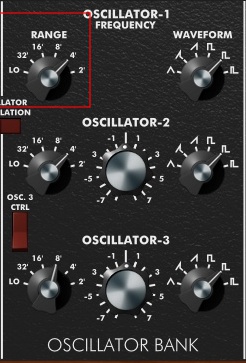
The Range knob selects the octave of oscillator 1. The “Lo” setting allows you to bring the octave down even further, allowing the oscillator to be used as a modulation source.
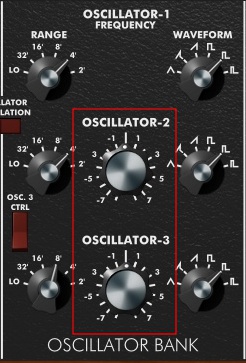
There are 3 oscillators. Oscillators are the primary source of sound. Since there are 3 this means that
each key can sound up to 3 oscillators each within its own waveform, octave, and pitch. The mixer then controls the balance between them.
Oscillator 2 and 3 have frequency knobs. It will detune from Oscillator 1. Detuning slightly can create a “chorus” effect. You can also tune the oscillators to intervals like a 5th above or a 4th below.
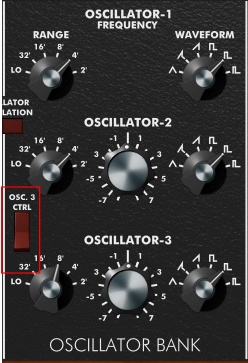
Oscillator 3 switch. Turning the switch off releases Oscillator 3 and provides a greater range of frequency control and allows it to run as a modulation source.
Waveforms
Each Oscillator has a WAVEFORM knob. Each knob offers 6 choices. Before we can understand the functions of each we need to understand waveforms. A waveform is basically a graph or visual image of sound. It allows us to see changes that are occurring and define its structure. A wavelength of a waveform is the time it takes for the sound to complete one cycle. The topic of waveforms and wavelengths can get very deep and technical. I am giving you the short and sweet crash course version. If you would like to further your knowledge on the topic you can do so here.
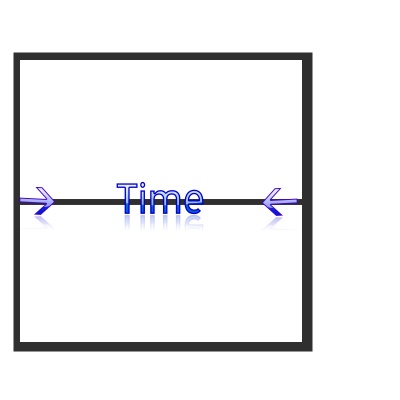
Below is a blank graph.

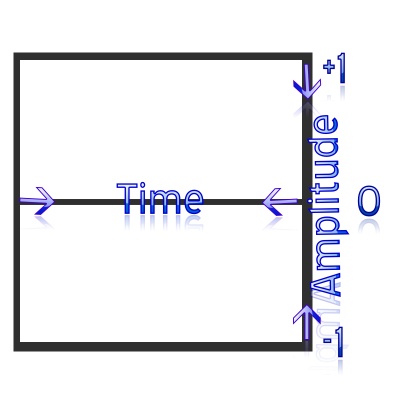
The center line from left to right represents time.
The center line also represents our sound at 0. Silence. Anything above or below is amplitude. Amplitude is also referred to as loudness.
The red lines represent our sound. It has cycled twice. Each cycle is 0.5 seconds long.
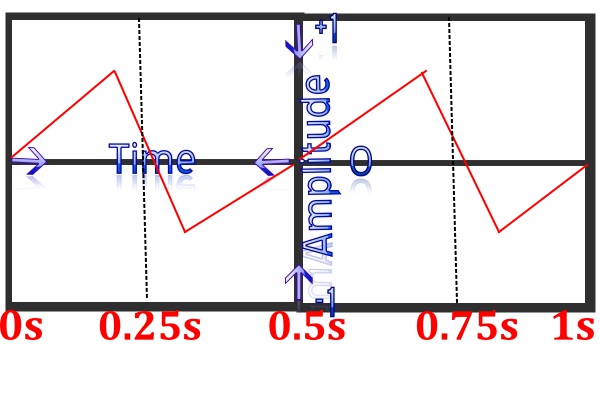
Frequency is measured as the number of wave cycles that occur in one second. The unit of frequency measurement is Hertz (Hz for short). A frequency of 1 Hz means one wave cycle per second. A frequency of 10 Hz means ten wave cycles per second, where the cycles are much shorter and closer together. Since our graph measured a time of 1 second and the wave has repeated twice in that time we can then conclude the wave is oscillating at 2Hz. Frequency is like pitch. The slower the lower, the faster the higher.
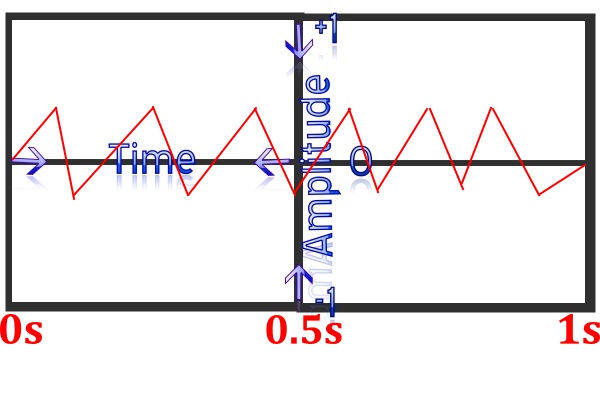
In this instance, our wave cycled 6 times in the same time of 1 second making it a higher pitch than when the wave cycled twice. Another way to look at frequency and pitch is if you took a record and slowed it down, the pitch or frequency would be lower. If you speed it up and it then sounded like chipmunks singing, the frequency or pitch would be higher.
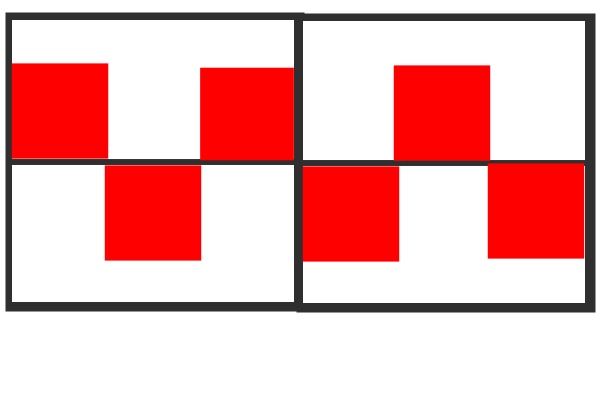
Square, Triangle, and Sawtooth are simple waves that contain a consistent harmonic structure. Their simplicity comes from being continuous and repetitive. A cycle of a square looks identical to the one prior as seen below.


No responses yet